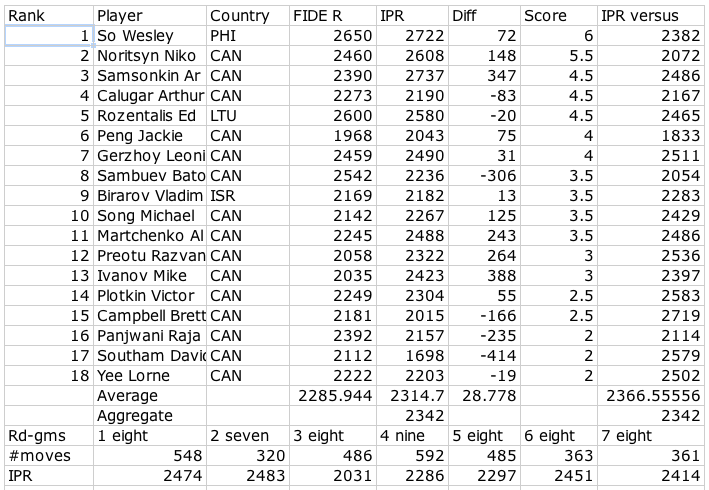
I had previously posted my "Single-PV quick run" of the Toronto International; now here are the results of my Multi-PV run which evaluates alternative moves in full and allows the computation of "Intrinsic Performance ratings" (IPRs):

As with my full run of last year's Canadian Open (624 games---see table at the end of my published academic paper with Guy Haworth and GM Bartlomiej Macieja), the numbers support the contention that the FIDE ratings of the Canadian players are deflated---by over 50 points. Of course this is only 56 games, but I am currently running the COQ Premier and will run the Zonal to see if this result holds consistently.
My Excel spreadsheet image also breaks down by round---again it is hard to draw conclusions from only 8-9 games per round (I've omitted the error bars which are over 200 Elo points in both directions for every player or round), but it seems the effect of the two-round opening Sunday and evening thunderstorm were not felt until the next day!? The main reason the "Average" and "Aggregate" rows have different values for IPR's is that "Aggregate" lumps together all the moves and different players had widely different numbers of moves.
Incidentally I'll shy away from posting my entire IPR spreadsheet of a big Open, on grounds that the IPRs might be taken as "personal" like IQ figures, but I consider top finishers and Master-plus players and those playing in a premier section to be fair game...hope that's OK. As I offered before, people are anyway welcome to e-mail me for their IPR figures from last year's Canadian Open (top section).


Comment