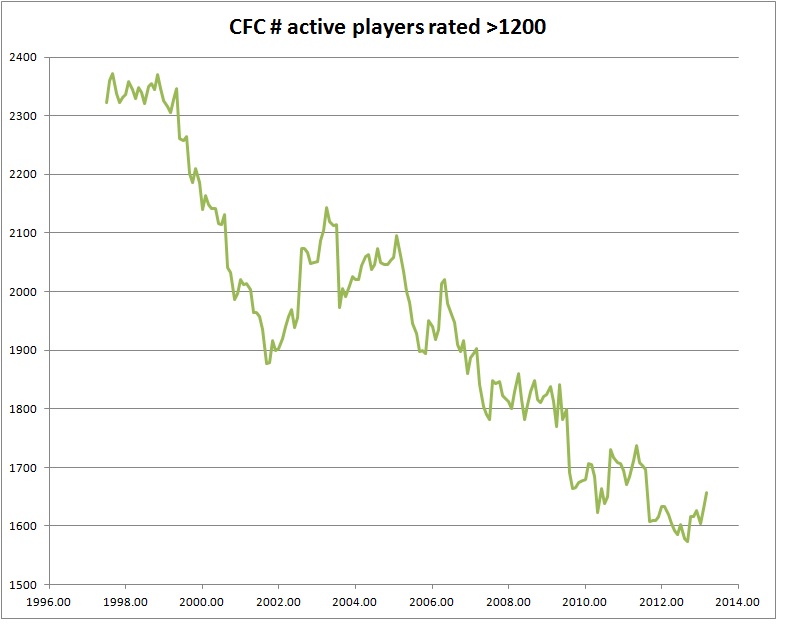
just over 2 years ago, I published some stats on CFC activity. I decided to update some of those graphs as I was interested in the substantial increase in tournament attendance in BC.
Unhappily, the downward trend of the last 15 years has continued. You can see the result for Canada as a whole below. Graphs for the individual provinces are at:
www.victoriachess.com/cfc/activity_update.htm
some points to remember:
1) for the provinces, the activity count includes people from out of province who played in an event. So, to figure out trends for a province, you should subtract out things like the Canadian Open or CYCC which appear as a broad spike (and are pretty obvious).
2) The recent data for the Canada graph below includes the effects of the agreement with the FQE. These players are not of course new members or even new players but represent previously unrecognized activity. So, the graph for Canada for the last few years is actually worse than the appearance (i.e. subtract out the effects of the FQE agreement).
3) as for my interest, BC, tournament attendance has been up sharply but in fact the total number of active players has remained flat. So we have not succeeded in increasing the number of players - they are just playing more often (which makes sense - I had previous data that BC players played less than the national average, probably due to a lack of tournaments at the time) (although in comparison to the national trend, staying flat is a success...)
4) several provinces have managed to stay more or less constant and buck the national trend.


Comment