If this is your first visit, be sure to
check out the FAQ by clicking the
link above. You may have to register
before you can post: click the register link above to proceed. To start viewing messages,
select the forum that you want to visit from the selection below.
Policy / Politique
The fee for tournament organizers advertising on ChessTalk is $20/event or $100/yearly unlimited for the year.
Les frais d'inscription des organisateurs de tournoi sur ChessTalk sont de 20 $/ÕvÕnement ou de 100 $/annÕe illimitÕe.
You can etransfer to Henry Lam at chesstalkforum at gmail dot com
TransfÕr Á Henry Lam Á chesstalkforum@gmail.com
Dark Knight / Le Chevalier Noir
General Guidelines
---- Nous avons besoin d'un traduction franÓais!
Some Basics
1. Under Board "Frequently Asked Questions" (FAQs) there are 3 sections dealing with General Forum Usage, User Profile Features, and Reading and Posting Messages. These deal with everything from Avatars to Your Notifications. Most general technical questions are covered there. Here is a link to the FAQs. https://forum.chesstalk.com/help
2. Consider using the SEARCH button if you are looking for information. You may find your question has already been answered in a previous thread.
3. If you've looked for an answer to a question, and not found one, then you should consider asking your question in a new thread. For example, there have already been questions and discussion regarding: how to do chess diagrams (FENs); crosstables that line up properly; and the numerous little glitches that every new site will have.
4. Read pinned or sticky threads, like this one, if they look important. This applies especially to newcomers.
5. Read the thread you're posting in before you post. There are a variety of ways to look at a thread. These are covered under Display Modes.
6. Thread titles: please provide some details in your thread title. This is useful for a number of reasons. It helps ChessTalk members to quickly skim the threads. It prevents duplication of threads. And so on.
7. Unnecessary thread proliferation (e.g., deliberately creating a new thread that duplicates existing discussion) is discouraged. Look to see if a thread on your topic may have already been started and, if so, consider adding your contribution to the pre-existing thread. However, starting new threads to explore side-issues that are not relevant to the original subject is strongly encouraged. A single thread on the Canadian Open, with hundreds of posts on multiple sub-topics, is no better than a dozen threads on the Open covering only a few topics. Use your good judgment when starting a new thread.
8. If and/or when sub-forums are created, please make sure to create threads in the proper place.
Debate
9. Give an opinion and back it up with a reason. Throwaway comments such as "Game X pwnz because my friend and I think so!" could be considered pointless at best, and inflammatory at worst.
10. Try to give your own opinions, not simply those copied and pasted from reviews or opinions of your friends.
Unacceptable behavior and warnings
11. In registering here at ChessTalk please note that the same or similar rules apply here as applied at the previous Boardhost message board. In particular, the following content is not permitted to appear in any messages:
* Racism
* Hatred
* Harassment
* Adult content
* Obscene material
* Nudity or pornography
* Material that infringes intellectual property or other proprietary rights of any party
* Material the posting of which is tortious or violates a contractual or fiduciary obligation you or we owe to another party
* Piracy, hacking, viruses, worms, or warez
* Spam
* Any illegal content
* unapproved Commercial banner advertisements or revenue-generating links
* Any link to or any images from a site containing any material outlined in these restrictions
* Any material deemed offensive or inappropriate by the Board staff
12. Users are welcome to challenge other points of view and opinions, but should do so respectfully. Personal attacks on others will not be tolerated. Posts and threads with unacceptable content can be closed or deleted altogether. Furthermore, a range of sanctions are possible - from a simple warning to a temporary or even a permanent banning from ChessTalk.
Helping to Moderate
13. 'Report' links (an exclamation mark inside a triangle) can be found in many places throughout the board. These links allow users to alert the board staff to anything which is offensive, objectionable or illegal. Please consider using this feature if the need arises.
Advice for free
14. You should exercise the same caution with Private Messages as you would with any public posting.
We should listen to a renowned scientist’s warning on climate change.
[By: Thomas Homer-Dixon: executive director of the Cascade Institute at Royal Roads University and professor emeritus at the University of Waterloo. Scientist: Dr. James Hansen: Throughout his long career, Dr. Hansen has developed a reputation for being consistently ahead of the scientific curve in his assessment of climate change and its implications, most famously in the summer of 1988 when, as director of the NASA Goddard Institute, he brought public attention to global warming in testimony to the United States Senate. Now retired from NASA and based at Columbia University, he’s still vigorously engaged in climate science and policy advocacy.]
"Earth’s climate is much more sensitive to humanity’s carbon dioxide emissions [Emphasis added]than conventionally estimated. Taking into account feedbacks involving clouds, water vapour, snow cover and sea ice, “equilibrium climate sensitivity” – the eventual warming produced by a doubling of CO2 in the atmosphere – is likely around 4.8 C, rather than the IPCC’s best estimate of 3 C." [!! Emphasis Added]]
Astrophysicist, Piers Corbyn, dispels the fairy tale that CO2 controls the temperature of the planet: "The problem with the current climate change narrative is that it's false. It claims that carbon dioxide controls world temperatures, whereas actual data shows that it's world temperatures which control the carbon dioxide concentration."
Just this past week, New York City suffered floods due to precipitation levels not seen in a single day since 1948. That's 75 bleeping years. The extent of the widespread damages is still being worked out.
Guess what that is going to do to property insurance rates in New York City?
Property Insurance companies are the canary in the coal mine; if you want to know whether we are in a climate emergency, follow the falling fortunes of the biggest property insurers and of their customers. Never mind what CO2 levels might have been hundreds of thousands of years ago.
Yet more evidence that property insurance is the next big economic crisis* in the USA.... due to the effects of climate change....
"If you're not worried, you're not paying attention."
* .... well, competing with it for next big economic crisis in the USA is the impending collapse of the commercial real estate market due to so much remote work after the pandemic, thus leaving many downtown office buildings in major cities mostly empty....
Last edited by Pargat Perrer; Monday, 20th November, 2023, 05:00 AM.
How are we doing on our plan (Do we have one?) for Species Survival?
"One Huge Contradiction Is Undoing Our Best Climate Efforts
The math isn’t adding up.
The world is still using more energy each year, our consumption ticking ever upward, swallowing any gains made by renewable energy. Emissions are still rising—more slowly than they used to but, nonetheless, rising. Instead of getting pushed down, that needle is fitfully jiggling above zero, clawing into the positive digits when it needs to be deeply pitched into the negative. We are, in other words, simply not making a dent."
"But as air pollution falls, so too does the concentration of that particulate matter that happened to be deflecting a not-inconsiderable amount of solar radiation.
One striking example is currently playing out on the high seas. In 2020, a new rule went into effect that sharply limited the amount of sulfur dioxide in shipping fuel. It substantially reduced air pollution, according to research by NASA.
Yet it appears that the reduction in particulate matter is also letting more solar radiation in, contributing to global warming. An analysis by Carbon Brief estimated that the regulations will be responsible for increasing global temperatures by .05 degrees Celsius by 2050.
That alone is not enough to explain the record high temperatures that have baked the globe this year. But scientists know it’s a factor, and every fraction of a degree counts. “We know that there’s an effect, but nobody has properly quantified it yet,” Visioni said."
But I know for years, vegetarians have answered the issue of overpopulation/food security, with the simple solution of: eliminate carnivore-oriented farming; morph into grain/rice/lentil/etc. oriented farming. All modelling shows that the amount of food produced will easily feed the growing Earth population (Both Human & Extra-terrestrial ) for some time.
Since you raised the concept of "Collapse of Civilization" (Much broader than this narrow "Negative Climate Change" thread), and in CT we hate people "hi-jacking" threads (!), I have started a new thread with your topic, and re-posted our two posts there, to start the ball rolling.
Hey Bob A, my youtube viewing strayed into the topic of collapse of civilization. This is an even wider canvas where climate change is one of several crisis that could bring down our civilization.
In fact, climate change can really be considered a symptom of a greater cause, that of ecological overshoot. By that, we mean there are too many people consuming the planetary resources faster than the planet can regenerate. We currently have 8 billion people and climbing, but the planet can only support 3 billion (estimates vary) based on current capacity.
I was wondering what you thought. I found a great channel on the topic, here is a sample.
Additional carbon beyond 400-450 PPM where we are today (est) has no impact on the climate as all heat is absorbed in the first 400 PPM.
Supporting Reasons: Sid Belzberg Post # 1730-2 – 23/8/31
Opposition Challenge 1 - Bob Gillanders - Post # 1720 - 23/8/28
I think statement # 10 is outrageous.
If true, it would give the fossil fuel industry unlimited licence to burn everything, because hey "would have no impact on the climate".
As the church lady says, "how convenient".
I do follow climate updates elsewhere, and I don't see any mention of support for statement #10. I know Sid has cited a recent study by a couple of scientists, so if it does gain credibility elsewhere, I will let you know.
So instead of just letting statement #10 stand as is, I think some notation that it is not considered generally accepted as of now.
Opposition Challenge 2 - Bob Armstrong (As Participant) - Post # 1732 - 23/8/31
Statement # 6 now is:
Between 600 million and 400 million years ago, CO2 in Earth's atmosphere was quite high (over 600 ppm). Between 200 million and 150 million years ago, it had dropped to over 300 ppm. and remained there. But by 2022, almost 200 years after the start of the Industrial Revolution [1850], the percentage of the air/atmosphere that is CO2 had again spiked. "Carbon dioxide measured at NOAA’s Mauna Loa Atmospheric Baseline Observatory peaked for 2022 at 421 parts per million in May, pushing the atmosphere further into territory not seen for millions of years, scientists from NOAA and Scripps Institution of Oceanography offsite link at the University of California San Diego announced today. "
[ Note: The significance of CO2 as a factor in negative climate change is hotly debated. Whether CO2 production from the time of the Industrial Revolution is relevant is also hotly debated. These await further Statements, if any generally accepted Statements are possible.]
Sid's Statement # 10 (Proposed) is roughly in agreement with the fact re current CO2:
Additional carbon beyond 400-450 PPM where we are today (est) has no impact on the climate as all heat is absorbed in the first 400 PPM.
But other scientists draw very opposite conclusions from Sid's Statement # 10! Recently moving into the 400 PPM range is a big spike in the percentage of CO2 in the atmosphere. Many scientists see the spike as due to anthropogenic activity (The Industrial Revolution). And they clearly link the increase in CO2 to the increase in temperature (Part of the Non-Porous Greenhouse Gas Canopy argument):
Opposition Challenge # 2 - Bob Armstrong - Post # 1791 - 23/10/3
"There IS a "climate emergency". Tons of material now exists in the public domain to this effect. Governments and private organizations (World Economic Forum) are sounding the alert. We are seeing the effects of climate change across the globe: wildfires; floods; landslides; rising sea levels; melting polar caps; etc. It is now well-accepted, both inside this group, and in the world at large, that it is likely the human species will be unable to adapt to this new increasingly hostile environment, and will go extinct.
What other definition is there of an "emergency".
The fact of this very thread shows that there is NO general acceptance within this group (This is Post # 1,791!! and BOTH sides are posting their little hearts out).......there IS raging controversy
This Statement is both wrong, and not generally accepted by this group."
Opposition Challenge # 3 - Pargat Perrer - Post # 1792 - 23/10/3
"Just this past week, New York City suffered floods due to precipitation levels not seen in a single day since 1948. That's 75 bleeping years. The extent of the widespread damages is still being worked out.
Guess what that is going to do to property insurance rates in New York City?
Property Insurance companies are the canary in the coal mine; if you want to know whether we are in a climate emergency, follow the falling fortunes of the biggest property insurers and of their customers. Never mind what CO2 levels might have been hundreds of thousands of years ago."
C. Secretarial Rulings
I – Procedural
Ruling # P1 (Post # 1624 – 23/8/23)
New Proposed Statements must be accompanied by a short, executive summary, set of reasons.
[Note: If the Support Texts are extensive, they will have to be shortened by the proposer; these Statements are often repeated and updated in future postings, and extensive support texts, with graphs/charts/ long book or report quotes, etc., will simply become too unwieldy; but the Post # & date of the Extensive support texts will be noted for those viewers wanting more information than the executive summary.]
II – Substantial
Ruling # S1 (Post # 1682 – 23/8/24)
There shall be put forward no Statement on the cause of current Canadian wildfires.
Support
There is great controversy outside this group, and inside, as to the cause of current Canadian wildfires (Natural, Accidental Human, Deliberate Human [arson]). A generally accepted Statement is not possible.
D. CT'er Group Decisions
1. Discussion Protocol (Post # 1736 – 23/9/3)
This CT'er group will continue to use the "Generally Accepted" (The Conversation Format Protocol) Protocol . It has rejected the “Free-Form” discussion protocol.
2. Group Secretary Position (for group process in generating Statements) – Post # 1817 – 23/10/26)
The group secretary position is now unfilled.
Bob A (As Past Group Secretary)
Last edited by Bob Armstrong; Friday, 27th October, 2023, 05:47 PM.
[Part II of 3 parts; see Part III below; see Part I above]
Statement # 8
If farming has an effect on global negative climate change (Whether it does will be dealt with in another Statement, if possible), then any negative effect will be mitigated to some extent by the farming industry becoming “sustainable”. Sustainable agriculture is the efficient production of safe, high-quality agricultural product, in a way that protects and improves the natural environment, the social and economic conditions of the farmers, their employees and local communities, and safeguards the health and welfare of all farmed species.(Definition by Ontario Ministry of Agriculture, Food & Rural Affairs: https://www.omafra.gov.on.ca/english/busdev/facts/15-023.htm").
Support - Bob Armstrong - Post # 1606 - 23/8/7
The definition of sustainable agriculture used does not explicitly say that this involves necessarily only organic farming. The definition leaves open the possibility that Non-Organic farming could be "sustainable". It is argued that used correctly, certain fertilizers have no effect on health or the environment. But this is still an open question.
Secondly, the statement does not take any position on whether or not farming DOES have a negative effect on climate.
Statement 9
The two seminal papers by distinguished atmospheric physicists, William Happer of the Princeton University Department of Physics and William A. van Wijngaarden of the York University, Canada, Department of Physics and Astronomy prove that Methane and Nitrous Oxide emissions have no statistically meaningful effect on warming hence farming does not have anything to do with climate change.
Supporting Reasons: Sid Belzberg Post # 1646 – 23/8/15
Statement # 10
Carbon dioxide is not a dangerous pollutant. CO2 is the most important nutrient for all life on Earth, without it, we would be a dead planet.
Support Reasons: Sid Belzberg - Post # 1733 – 23/8/31 (Secretary)
Statement # 11
The average rate of temperature increase from 1695-2023 is .5 degrees per 100 years. 50% of this time was pre-industrial emissions of CO2.
Support
As expected, post-1850, the rise in CO2 emissions had no impact on the temperature whatsoever! The Hadcet dataset is a great model for climate change as the heart of the Industrial Revolution and industrial CO2 emissions was in the UK that began in 1850.
The average rate over a century is climate change, and variations year over year are the weather! The modern media attempts to confuse the two.
[Chart – Post # 1800 – 23/10/5]
The Central England temperature record (HadCET) contains the longest continuously measured thermometer-based regional temperature dataset in the world, going back more than 350 years. This record began in 1659, in the depths of the Little Ice Age (1250 – 1800) which was marked by some of the coldest temperatures in nearly 8,000 years. The period of the late 17th century and early 18th century was a horrifically cold period known as the Maunder Minimum. Thankfully, the current warming trend we are in began in the year 1695. The next 40 years had more than twice the rate of warming as we experienced in the 20th century. The first half of this 300-plus year warming had about the same amount of temperature rise as the latter half and was entirely naturally driven. The natural forces driving temperature changes for the first 200 years of this temperature history did not cease functioning in the 20th century.
Temp: Parker DE, Legg TP, Folland CK (1992) A new daily Central England Temperature Series, 1772 – 1991. Int. J. Clim., Vol 12, pp 317–342, https://www.metoffice.gov.uk/hadobs
CO2: Boden TA, Marland G, Andres RJ (2016) Global CO2 emissions from Fossil-Fuel Burning Cement Manufacture and Gas Flaring 1751 – 2013. CDIAC, Oak Ridge National Laboratory, U.S. Dept of Energy, Oak Ridge, TN, USA, DOI 10.3334/CDIAC/00001_V2010
Statements on Negative Climate Change Generally Accepted by a Group of Canadian tournament Chess Players on the national chess discussion board, ChessTalk (Non-Chess Topics). The individuals represent a political partisan spectrum, and an issue spectrum.
We now have 11 STATEMENTS (None currently challenged).
We use “The Conversation Format Protocol (TCFP)”. All Statements are a work-in-progress and open to a new "Challenge" at any time.
A. Statements
Statement # 1
Solar Activity is the main driver of climate change. It is heat from the sun that is the "source" of the rising air/atmospheric temperature of Earth.
Support - Bob Armstrong (Post # 1453 – 23/7/20 - slightly edited) - "Our new Commonly Accepted Statement # 1 does not play one way or another as to whether the rise in temperature is a “problem”. It merely states the fact that Naturalists agree with - their fact is that the average rising temperature is about .5 degrees C every 100 years.....that is "rising" temperature."
Statement # 2
Earth's mean temperature is now rising, has been for some time, and will likely continue to rise for some time in the future.
Support 1 – Bob Armstrong – Post # 1485 – 23/7/22 [Lightly Edited]
“The post of Sid Belzberg (Post # 1296 – 23/4/29) "supports" Statement # 2! He asserts evidence that the average rate of increase is ".5 degrees every 100 years" over a 300 year period. This confirms "the temperature is now rising, and has been for some time".
Arguably, if it has been rising for 300 years, and you look at all the human problems arising from this rising heat (See Statement # 3), then heat is going to "likely continue to rise for some time in the future". We, of course, at this point in developing our Statements, have not taken on the issue, yet, of whether this trend of .5 degrees per 100 years is the expected increase for the future.”
Support 2 – Bob Armstrong – Post # 1523 – 23/7/27
“The New Warming Climate State/Multi-Century Temperature Periods
Scientists concluded a few years ago that Earth had entered a new climate state not seen in more than 100,000 years. As fellow climate scientist Nick McKay and I recently discussed in a scientific journal article, that conclusion was part of a climate assessment report published by the Intergovernmental Panel on Climate Change (IPCC) in 2021.
Earth was already more than 1 degree Celsius (1.8 Fahrenheit) warmer than preindustrial times, and the levels of greenhouse gases in the atmosphere were high enough to assure temperatures would stay elevated for a long time.
“The term “Record-Breaking” is sometimes loosely/wrongly used in the Main Stream Media re Earth's currently rising temperature. Cities across the globe may have unique geographic and meteorological characteristics that determine current temperature variations. Fact checking may be necessary.”
Statement # 4:
Currently rising air/atmospheric temperature of Earth is a problem for humanity.
Support 1 - Bob Gillanders (Post # 1468 – 23/7/19)
"Seems crazy and very hard to believe that they [Texas Governor, Greg Abbot,] would have to legislate employers to allow such breaks from a scorching heat work environment, but apparently that is the case. The water breaks since 2010 that Governor Abbott now wants to take away has reduced the death toll on workers significantly."
Support # 2 - Fred Harvey (Post # 1470 - 23/7/19)
"I have lived in the same town for 50 plus years (how dull...not). Amongst other things, I have seen the tomato growing season go from 2.5 months to 4 months. For 35 years we lived without air-conditioning....now not so much. Them's two facts that suggest significant warming."
Support # 3 - Bob Armstrong (Post # 1451 - 23/7/11)
"I, for one, believe we see "problems" for human living all around us every day, the world over, from rising heat levels (Regardless of arguing over why the heat is rising or the rate at which it is rising)."
Statement # 5
Since the year 1650 (200 years before the Industrial Revolution [Started: 1850], which is the earliest global temperature recording), the Earth's mean temperature has been rising naturally (Earth has been in a natural warming cycle; it has gone through various cooling and warming cycles before this current warming one). There is surface temperature data for the period 1650 to 1850, and beyond, from the records of the UK Meteorological Observatory. Some propose that they are sufficient to use to analyze our increasing temperature problem.
Support - Sid Belzberg - Post # 1296 (23/4/29)
"Given that heart of the early Industrial Revolution started in the UK, where manmade CO2 emissions were significant, it is an excellent platform to analyze the data.”
Statement # 6
Between 600 million and 400 million years ago, CO2 in Earth's atmosphere was quite high (over 600 ppm). Between 200 million and 150 million years ago, it had dropped to over 300 ppm. and remained there. But by 2022, almost 200 years after the start of the Industrial Revolution [1850], the percentage of the air/atmosphere that is CO2 had again spiked. "Carbon dioxide measured at NOAA’s Mauna Loa Atmospheric Baseline Observatory peaked for 2022 at 421 parts per million in May, pushing the atmosphere further into territory not seen for millions of years, scientists from NOAA and Scripps Institution of Oceanography offsite link at the University of California San Diego announced today. "
[ Note: The significance of CO2 as a factor in negative climate change is hotly debated. Whether CO2 production from the time of the Industrial Revolution is relevant is also hotly debated. These await further Statements, if any generally accepted Statements are possible.]
Supporting Reasons - Bob Armstrong - Post # 1735 - 23/9/1
The source of the percentage of CO2 in the air, both historically, and currently is given. The spike in CO2 after the human Industrial Revolution (Approx. 1850 A.D.) coincides with the period of increased warming. CO2 is only one of the greenbelt gases forming the non-porous heat canopy around the Earth.
This Statement deals only with CO2 in the air/atmosphere. It does not tie the rising temperature of the Earth to the spike in CO2; that will have to await future Statements, if there can be a generally accepted on in this group at all.
Statement # 7
It is essential to have alternate sources of energy; it is good that this transition is now underway; our options include renewables (solar panels, tidal, water turbines, windmills) and nuclear. Traditionally used fossil fuels, including coal, are finite, though more plentiful than commonly thought.
Support # 1 - Bob Gillanders (Post # 1415 – 23/7/2)
“Scientists have been warning us about climate change (global warming) for decades. The science is very complicated, but we now have 50 years of data to support the premise that burning fossil fuels is the primary cause. We need to free ourselves from our dependence on fossil fuels. Our options include renewables (solar panels, windmills) and nuclear.”
Why are scientists so slow to abandon their failed climate models?
CHRIS MORRISON, THE DAILY SCEPTIC
OCT 24, 2023
|
03:04 AM
The only way that global populations can be persuaded to embrace the insane policy of removing irreplaceable fossil fuel energy from human society within less than 30 years is to be kept in a perpetual state of fear. The climate must be seen to be tipping, collapsing and generally behaving in a way to turn Mother Earth into an uninhabitable fireball. Step forward the UN-backed Intergovernmental Panel on Climate Change (IPCC) that bases over 40% of its climate impact predictions on the implausible suggestion that temperatures will rise up to 4¯C in less than 80 years (current rate of progress over last 25 years – about 0.2¯C). Step forward climate scientists who use similar temperature projections to back 50% of their impact forecasts, and step forward trusted messengers in mainstream media who hide behind ‘scientists say’ as a cover for promoting almost any scary clickbait nonsense.
The distinguished academic and science writer Roger Pielke Jr. has been a fierce critic of using a set of temperature and emission assumptions in climate models known as RCP8.5. This scenario suggests temperatures could rise in short order by 3-4¯C, and it is responsible for producing much of the propaganda messaging that backs the collectivist Net Zero project. Pielke recently said that the continuing misuse of scenarios in climate research had become pervasive and consequential, “so much so that we can view it as one of the most significant failures of scientific integrity in the 21st Century so far”. Now Pielke has returned to the fray trying to understand how such obvious corruption of the scientific process has been allowed to stand for so long – the short explanation being “groupthink fuelled by a misinformation campaign led by activist climate scientists”.
Pielke starts by noting that he cannot explain why the “error” has not been corrected by the IPCC or others in authoritative positions in the scientific community. In fact, he says, “the opposite has occurred – RCP8.5 remains commonly used as a baseline in research and policy”.
Last March, the BBC ran a story claiming that Antarctica Ocean currents were heading for collapse. To drive home the scare, there was even a reference to the 2004 climate disaster film The Day After Tomorrow. The scientists’ claims were based on computer models fed with RCP8.5 data – a fact missing from the BBC’s imaginative story.
The above graph shows the progress the IPCC made from 2000 to 2014 in upping its baseline scenario to RCP8.5. Watts per square metre (W/m2) refers to the difference between incoming and outgoing radiation, or energy waves, at the top of the atmosphere. The RCP8.5 scenario takes its title from the W/m2 number. Interestingly, it might be noted that climate model temperature forecasts also started to go haywire from the middle of the 2000s, a fact that suggests activist scientists started work in earnest on producing the correct results needed to ferment the exploding green agenda.
Pielke observed that in 2000, the IPCC presented 40 baseline scenarios that described an envelope of possible emission futures. In 2014 it published its fifth assessment report (AR5), and although an earlier draft noted a majority of scenarios were above 6.0 the final report mentioned only RCP8.5. Since then, the IPCC has pulled back a little – noting in the latest assessment report (AR6) that the massive temperature rises are of “low likelihood”. But this admission is not to be found in the widely-distributed ‘Summary for Policy Makers’. A recent highly critical report on AR6 by the Clintel Foundation found that the IPCC was still using RCP8.5 that was “completely out of touch with reality”.
Despite the IPCC appearing to pull back a little, Pielke notes it still has many champions. Recently, the AR5 working group co-chair Chris Field and Marcia McNutt, President of the U.S. National Academy of Science, wrote that RCP8.5 had long been described as a ‘business-as-usual’ pathway with a continued emphasis on energy from fossil fuels with no climate policies in place. This was said to remain “100% accurate”.
How things change in just two decades of relentless green propagandising. In 2000, the authors of the UN’s Special Report Emissions Scenario (SRES) said:
The broad consensus among the SRES writing team is that the current literature analysis suggests that the future is inherently unpredictable and so views will differ as to which of the storylines and representative scenarios could be more or less likely. Therefore, the development of a single ‘best guess’ or ‘business-as-usual’ scenario is neither desirable or possible.
Such is the debate in 2000 of scientists working their way through the scientific process. But little evidence of such questioning can be found within the ranks of scientists following the agenda that has been ‘settled’ for them by political operatives. Today, RCP8.5 is deeply woven into the fabric of climate research and policy, observes Pielke. “Understanding how we got here should provide a cautionary warning for how science can go astray when we allow self-correction to fail,” he hopes. A less charitable view might be, don’t believe a word the IPCC, the legions of activist climate scientists and their useful idiots in the mainstream media say until they rid themselves of the RCP8.5 corruption.
This article was originally published by The Daily Sceptic and is republished here with permission
Last edited by Sid Belzberg; Tuesday, 24th October, 2023, 01:10 PM.
Change in Antarctic Ice Shelf Area from 2009 to 2019
Julia R. Andreasen, Anna E. Hogg, and Heather L. Selley
Abstract. Antarctic Ice Shelves provide buttressing support to the ice sheet, stabilising the flow of grounded ice and its contribution to global sea levels. Over the past 50-years satellite observations have shown ice shelves collapse, thin and retreat, however, there are few measurements of the Antarctic wide change in ice shelf area. Here, we use MODIS satellite data to measure the change in ice shelf calving front position and area on 34 ice shelves in Antarctica, from 2009 to 2019. Over the last decade, a reduction in area on the Antarctic Peninsula (6,692.5 km2) and West Antarctica (5,563.1 km2), has been outweighed by area growth in East Antarctica (3,532.1 km2) and the large Ross and Ronne-Filchner Ice Shelves (14,027.9 km2). The largest retreat was observed on Larsen-C Ice Shelf where 5,916.6 km2 of ice was lost during an individual calving event in 2017, and the largest area increase was observed on Ronne Ice Shelf in East Antarctica, where gradual advance over the past decade (535.3 km2/yr) led to a 5,888.6 km2 area gain from 2009–2019. Overall, the Antarctic Ice Shelf area has grown by 5,304.5 km2 since 2009, with 18 ice shelves retreating and 16 larger shelves growing in area. Our observations show that Antarctic Ice Shelves gained 660.6 Gt of ice mass over the decade whereas the steady state approach would estimate substantial ice loss over the same period, demonstrating the importance of using time-variable calving flux observations to measure change.
Solving Climate with Marxism, doesn’t solve the weather. It solves for your freedom.
Sid, your data maybe old......Antarctica is indeed melting, and at an alarming rate for 2023.
Change in Antarctic Ice Shelf Area from 2009 to 2019
Julia R. Andreasen, Anna E. Hogg, and Heather L. Selley
Abstract. Antarctic Ice Shelves provide buttressing support to the ice sheet, stabilising the flow of grounded ice and its contribution to global sea levels. Over the past 50-years satellite observations have shown ice shelves collapse, thin and retreat, however, there are few measurements of the Antarctic wide change in ice shelf area. Here, we use MODIS satellite data to measure the change in ice shelf calving front position and area on 34 ice shelves in Antarctica, from 2009 to 2019. Over the last decade, a reduction in area on the Antarctic Peninsula (6,692.5 km2) and West Antarctica (5,563.1 km2), has been outweighed by area growth in East Antarctica (3,532.1 km2) and the large Ross and Ronne-Filchner Ice Shelves (14,027.9 km2). The largest retreat was observed on Larsen-C Ice Shelf where 5,916.6 km2 of ice was lost during an individual calving event in 2017, and the largest area increase was observed on Ronne Ice Shelf in East Antarctica, where gradual advance over the past decade (535.3 km2/yr) led to a 5,888.6 km2 area gain from 2009–2019. Overall, the Antarctic Ice Shelf area has grown by 5,304.5 km2 since 2009, with 18 ice shelves retreating and 16 larger shelves growing in area. Our observations show that Antarctic Ice Shelves gained 660.6 Gt of ice mass over the decade whereas the steady state approach would estimate substantial ice loss over the same period, demonstrating the importance of using time-variable calving flux observations to measure change.
Solving Climate with Marxism, doesn’t solve the weather. It solves for your freedom.
Last edited by Sid Belzberg; Monday, 23rd October, 2023, 08:15 PM.
 ) for some time.
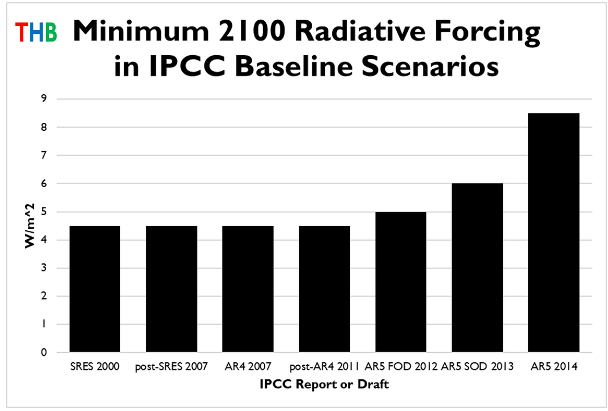
Leave a comment: